Discrepancy in 2D-Density Projection Alignment (imshow origin/transpose)
GUOBAO TANG
1 Apr '24
Hello,
I've been working with TNG100-1, specifically snapshot 99, and encountered a discrepancy in the alignment of two 2D density projections.
I plotted two density projections along the z-axis:
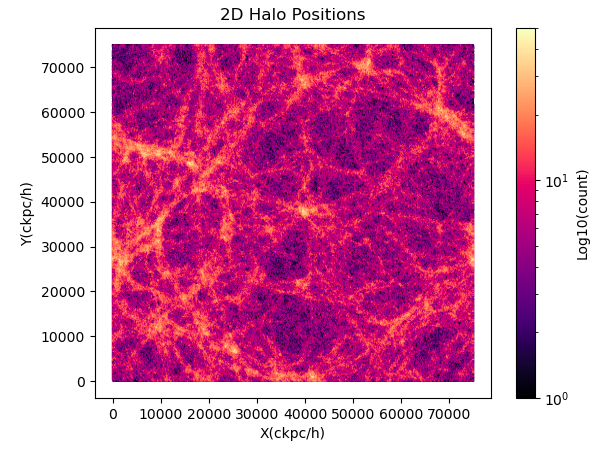
Halo Density Projection: Obtained by loading the 'GroupPos' catalogue at 'sims.TNG/TNG100-1/output', marking the x, y, z positions of halos with valid mass.
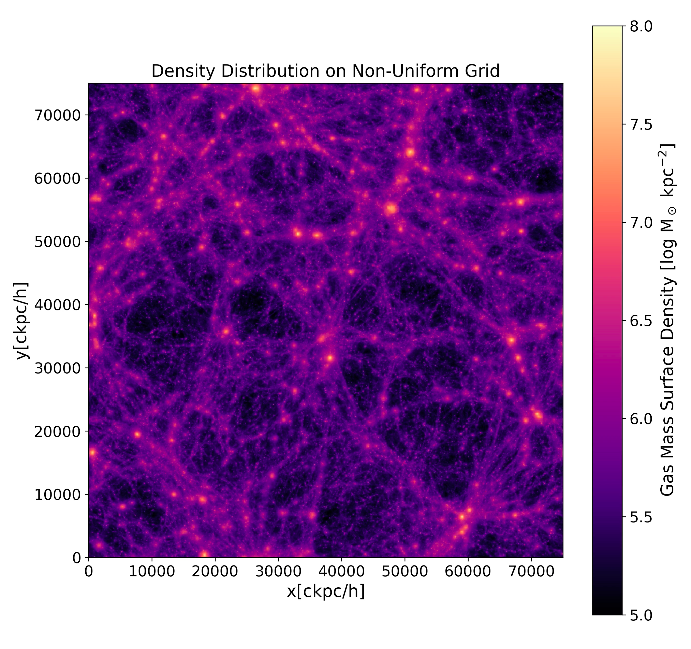
Gas Density Projection: Calculated by downloading gas particle positions and mass from the same snapshot using ['PartType0']['Coordinates'] and ['PartType0']['mass'], and then using binned_statistic_2d to plot it.
Additionally, I also attempted to visualize a slice of the data along the z-axis, encountering the same alignment issue.
the distributions look similar but require orientation adjustments. It seems that the underlying structures may indeed align, but there might be a systematic difference in orientation or axis scaling between the two plots. What's more, I found that a simple switch of x and y axes wasn't sufficient; I had to additionally use plt.gca().invert_yaxis() to rectify it.
I've double-checked the steps involved, and they seem straightforward without room for misalignment. Has anyone else encountered this discrepancy? Could it be a systematic issue, or am I overlooking something in my approach? Any insights or suggestions would be greatly appreciated. Thank you!
Dylan Nelson
7 Apr '24
I suppose you are using imshow in one case, but not the other? This just comes down to the definition of the image coordinates, versus simulation coordinates.
It is related to the extent keyword for imshow. You can also solve the issue by transposing. (You should double-check and be careful when showing any image, that the orientation is correct).
GUOBAO TANG
15 Apr '24
I think you are right. I didn't know imshow had a different coordinate convention. Thank you for taking the time to look at it. I'll be more mindful in the future.
Hello,
I've been working with TNG100-1, specifically snapshot 99, and encountered a discrepancy in the alignment of two 2D density projections.
I plotted two density projections along the z-axis:
Additionally, I also attempted to visualize a slice of the data along the z-axis, encountering the same alignment issue.
the distributions look similar but require orientation adjustments. It seems that the underlying structures may indeed align, but there might be a systematic difference in orientation or axis scaling between the two plots. What's more, I found that a simple switch of x and y axes wasn't sufficient; I had to additionally use plt.gca().invert_yaxis() to rectify it.
I've double-checked the steps involved, and they seem straightforward without room for misalignment. Has anyone else encountered this discrepancy? Could it be a systematic issue, or am I overlooking something in my approach? Any insights or suggestions would be greatly appreciated. Thank you!

I suppose you are using
imshowin one case, but not the other? This just comes down to the definition of the image coordinates, versus simulation coordinates.It is related to the extent keyword for imshow. You can also solve the issue by transposing. (You should double-check and be careful when showing any image, that the orientation is correct).
I think you are right. I didn't know imshow had a different coordinate convention. Thank you for taking the time to look at it. I'll be more mindful in the future.